
Tableau Dashboard on EV Market Trends


This project analyzes the growing electric vehicle (EV) market using a Tableau dashboard built from real-world data. The goal was to explore EV adoption trends across regions, manufacturers, and models, while assessing the impact of Clean Alternative Fuel Vehicle (CAFV) incentives. The dashboard reveals actionable insights for policymakers, manufacturers, and marketers alike
Tool: Tableau
Duration: Sept – Dec 2023
Course: Data Integrity & Visualization
Data Cleaning | Tableau Dashboards | Market Insights | Consumer Analysis | Policy Impact Analysis
Project Summary
Skills Applied
Removed irrelevant fields like VIN and cleaned missing data
Standardized pricing and range columns (Base MSRP, Electric Range)
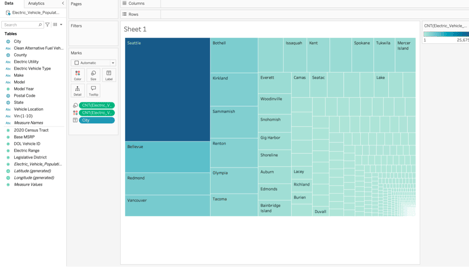
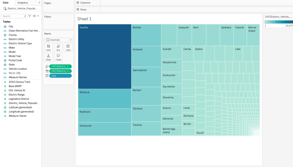
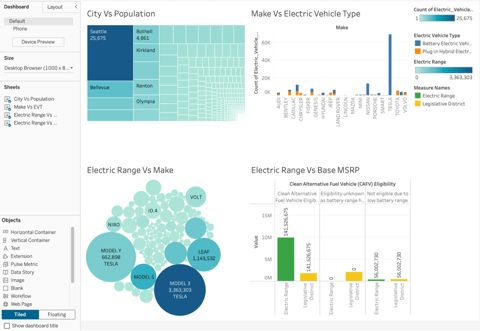
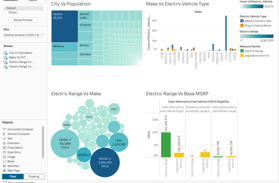
1. Geographic Distribution: Urban-Centric Growth
Seattle leads with 25,675 registrations, followed by Bothell and Bellevue.
EV adoption is concentrated in urban areas due to infrastructure and policy support.
Marketing Implication: Suburban & rural campaigns should focus on education + infrastructure.
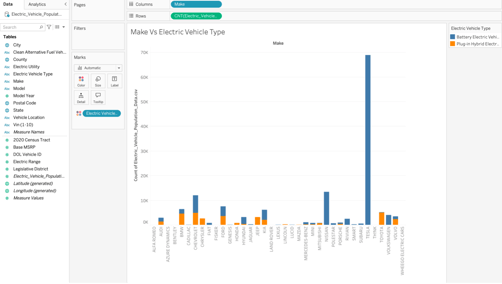
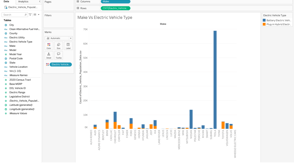
2. Tesla’s Market Leadership
Tesla dominates in the Battery Electric Vehicle (BEV) category.
Plug-in Hybrid Electric Vehicles (PHEVs) have lower uptake.
Brand Insight: Innovation and long range drive Tesla’s lead—other brands must catch up.
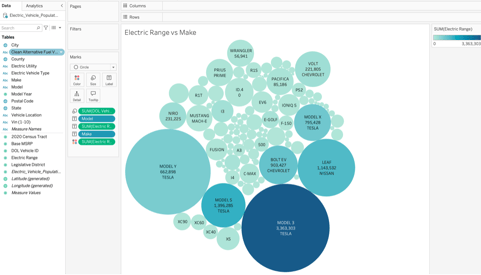
3. Consumer Preference: Range Equals Registrations
Tesla Model 3 is the most registered EV, followed by the Nissan Leaf and Model S.
Vehicles with higher electric range are favored.
Product Strategy: Invest in battery tech for cost-effective, long-range options.
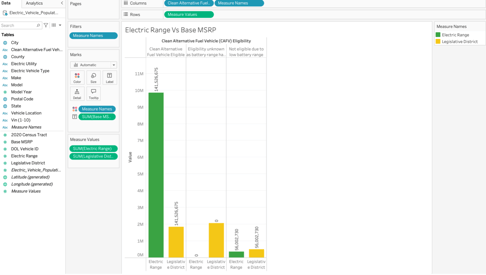
4. CAFV Incentive Effect
Vehicles eligible for CAFV programs have higher ranges and prices.
Ineligible vehicles see fewer buyers.
Policy Suggestion: Expand incentives to include mid-range EVs for broader appeal.

This project showcases how data storytelling can shape the future of sustainable transport. By leveraging Tableau, I identified strategic gaps and growth opportunities for the EV industry, blending data analysis with real-world marketing impact.
Data Prepration
Key Insights Uncovered
Conclusion
mjjackq@gmail.com

